


U.S. Employment Cost Index, Q1 2025 Commentary
2025 First Quarter Summary
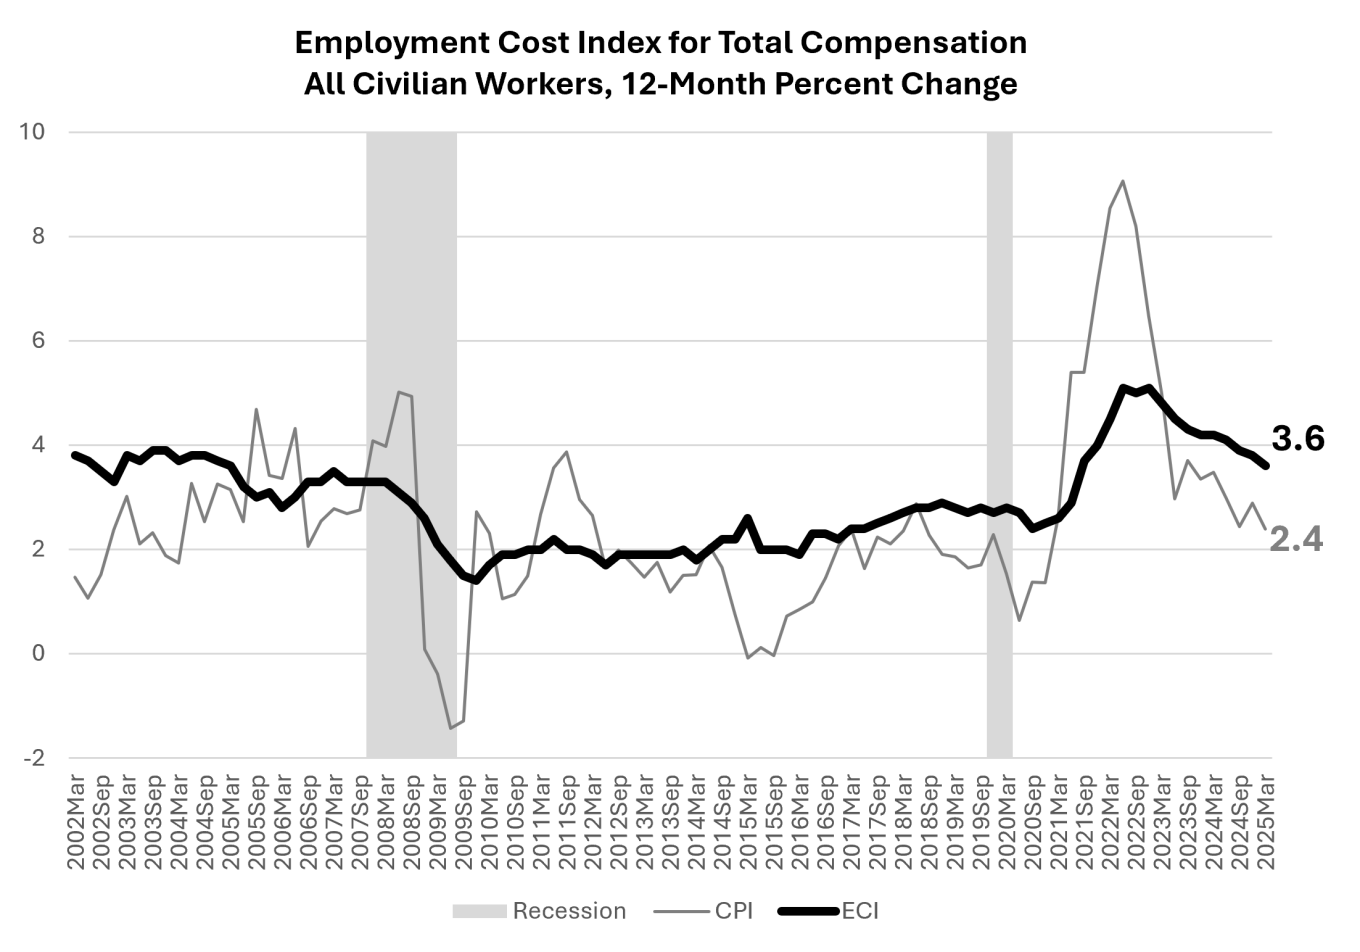
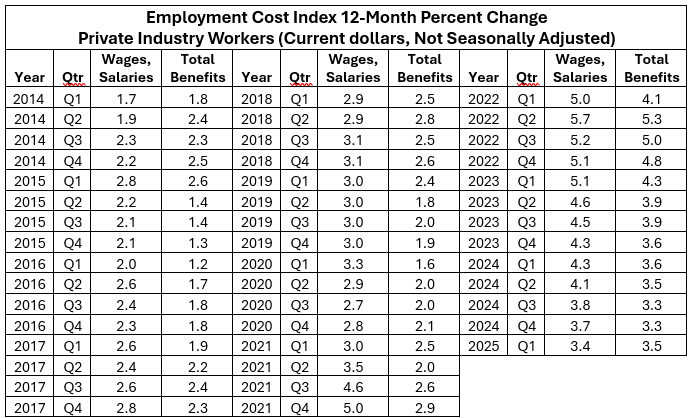
The 12-month current-dollar U.S. Employment Cost Index (ECI), which controls for occupational composition, extended its nine-quarter softening trend, while remaining solidly above general inflation. Released on April 30, 2025, the U.S. Bureau of Labor Statistics’ ECI for the 12 months ending in March reported in at 3.6 percent. The US household Consumer Price Index (CPI) for the same 12-month period was 2.4 percent. (Chart 1, Table 1). Thus, this quarter’s ECI continues the run of good news for the purchasing power of employees’ pay that began in June 2023.
Chart 1
Institute for Compensation Studies
Data Source: U.S. Bureau of Labor Statistics, Employment Cost Index, March 2025, released April 30, 2025.
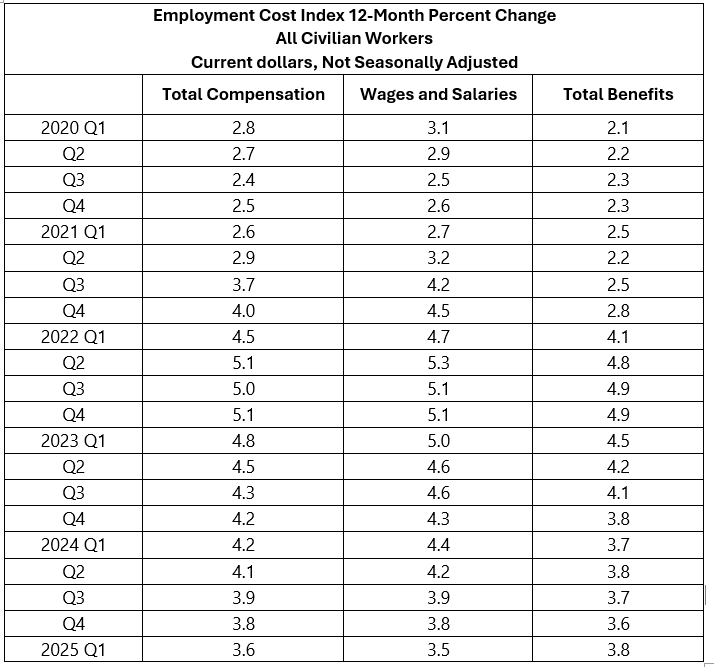
Table 1
Institute for Compensation Studies
Data Source: U.S. Bureau of Labor Statistics, Employment Cost Index, March 2025, released April 30, 2025.
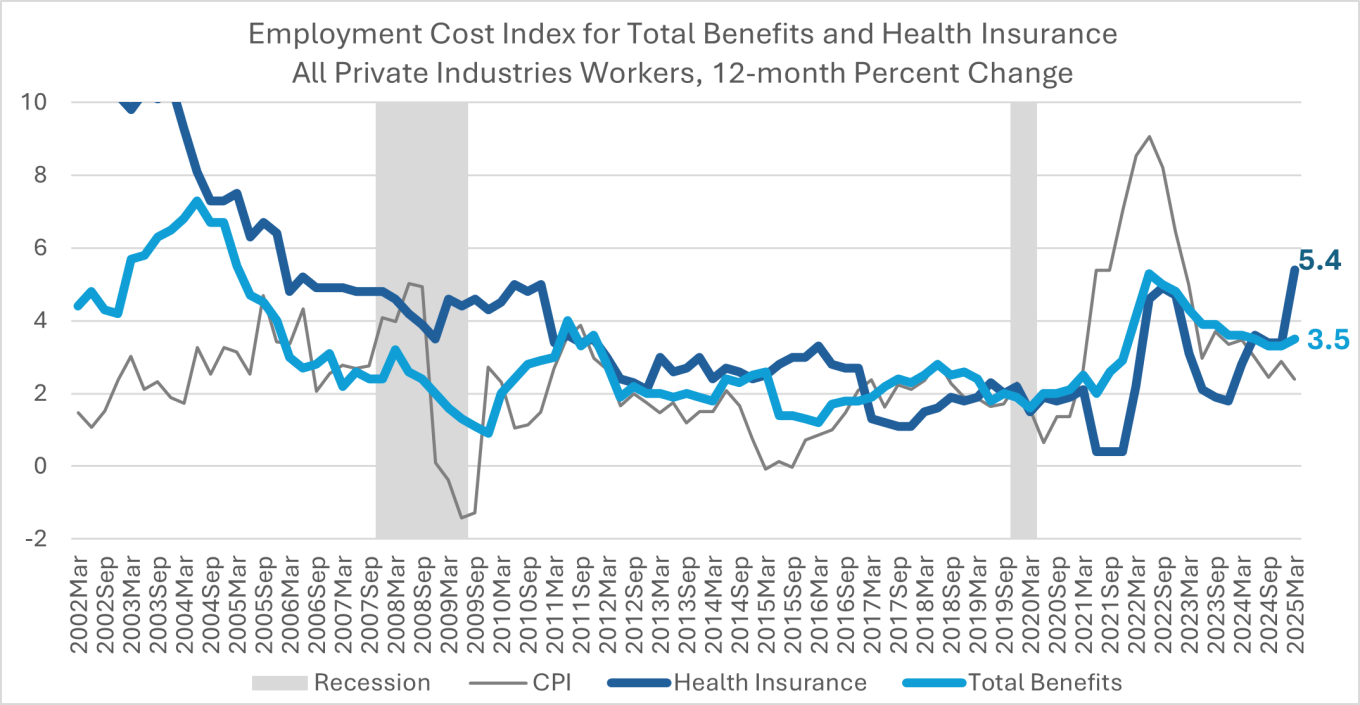
Total and Healthcare Benefits
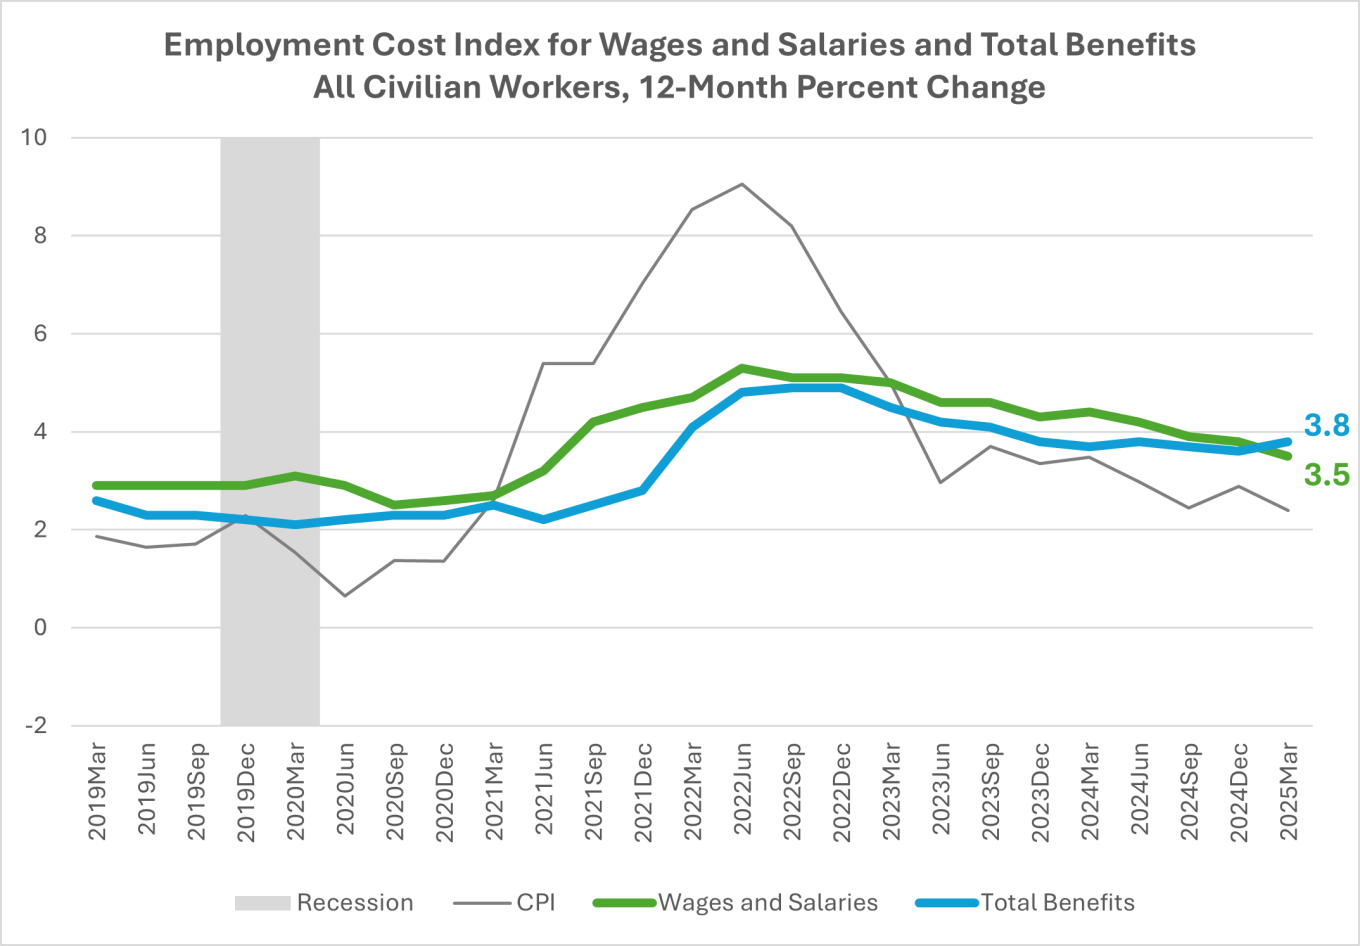
After converging throughout 2024, the growth rate of total benefits has now risen above that of wages and salaries for U.S. workers (Chart 2).
Chart 2
Institute for Compensation Studies
Data Source: U.S. Bureau of Labor Statistics, Employment Cost Index, March 2025, released April 30, 2025.
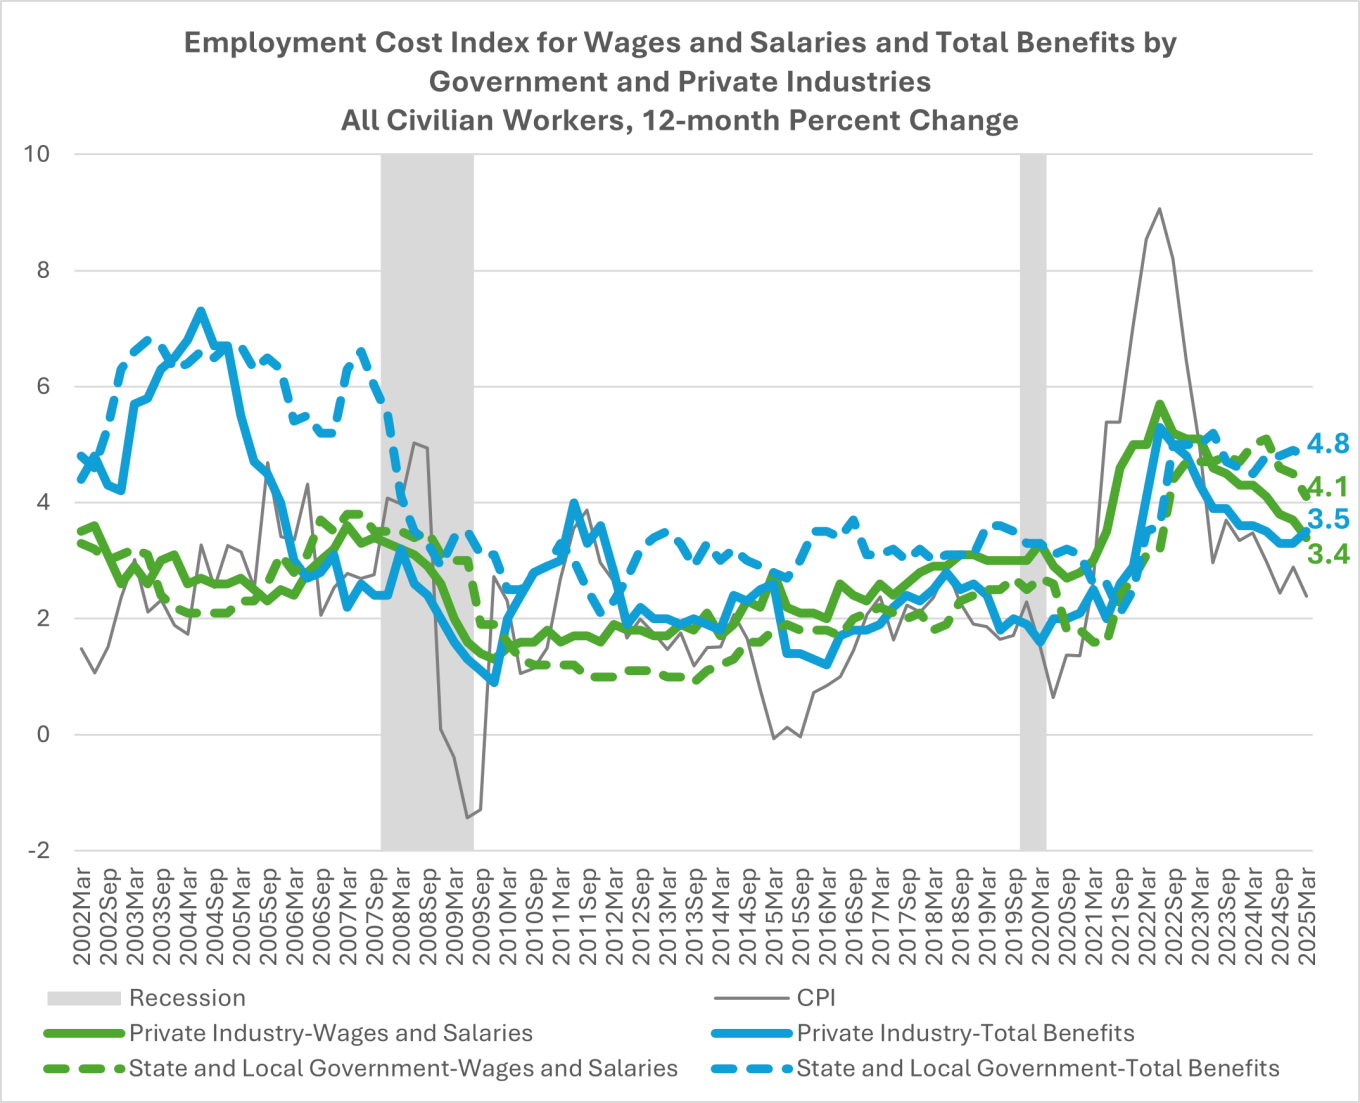
Looking separately at Private Industry and State and Local Government reveals that the acceleration in the employer cost of employee benefits is isolated within the private sector, specifically healthcare benefits of private sector employees (Chart 3, Table 2, and Chart 4).
While the recent restructuring of the federal government is highly impactful, it should be noted that the impact is not visible in this Employment Cost Index report for several reasons. First, federal workers are excluded by design. The government employers in this survey are exclusively state and local government agencies. Most federal employees’ wages are subject to the General Schedule Base Payscale, which increased by 1.7% from 2024, effective in January 2025. Second, the direct impact of layoffs from federal grantees or contractors (whether private sector or state or local public service) is also excluded, because the ECI is designed to control for compositional changes in employers’ workforces. Third, it is unlikely that indirect impacts on compensation from changing labor market conditions would show up yet in the ECI. The new administration began on January 20, 2025. Any broad impact of federal restructuring (such as a recession or boom) would take a while to take hold and affect compensation growth as measured in the ECI.
In comparing the growth of employee compensation costs for State and Local Government with that of Private Industries, only the 12-month ECI for employer-provided benefits in the private sector increased this quarter, ticking up from 3.3 to 3.5 percent. The year-on-year growth rate of salary and wages and of benefits for State and Local Government employees softened, as did that of salary and wages for employees in Private Industries (Chart 3).
Chart 3
Institute for Compensation Studies
Data Source: U.S. Bureau of Labor Statistics, Employment Cost Index, March 2025, released April 30, 2025.
Q1 2025 marks the first quarter since Q4 2014, a decade ago, that private employers’ benefits costs grew faster than their wage and salary costs, and ends a three-year deceleration trend in 12-month benefits cost growth (Table 2).
Table 2
Institute for Compensation Studies
Data Source: U.S. Bureau of Labor Statistics, Employment Cost Index, March 2025, released April 30, 2025.
Private sector employer costs for employee benefits surged, with a strong contribution from health insurance costs (Chart 4).
Chart 4
Institute for Compensation Studies
Data Source: U.S. Bureau of Labor Statistics, Employment Cost Index, March 2025, released April 30, 2025.
This may reflect the beginning of health insurance plan years that incorporate higher usage of expensive drugs, particularly weight loss drugs. Consumer healthcare price indexes show no such surge, so the difference in insurance costs likely reflects changes in usage, not pricing. If taking the new drugs helps prevent future medical costs and absences from work, employers’ increased costs for employee health insurance could eventually be partially or fully offset by savings elsewhere.
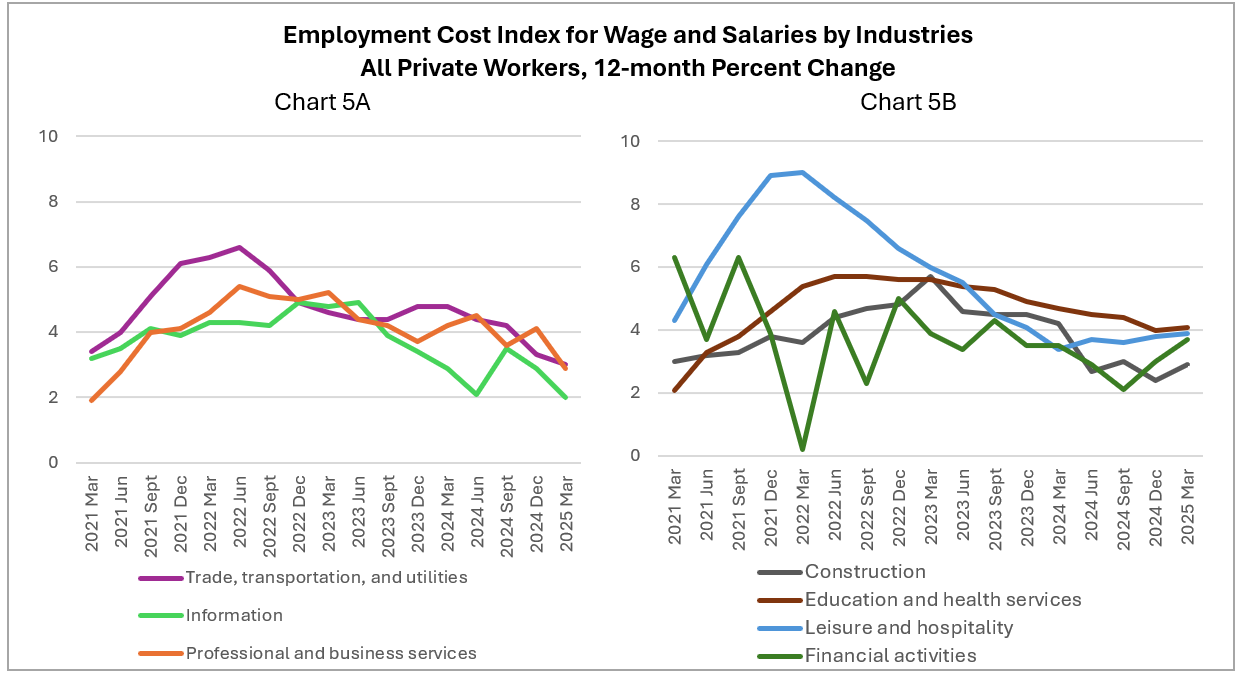
Sector Differences
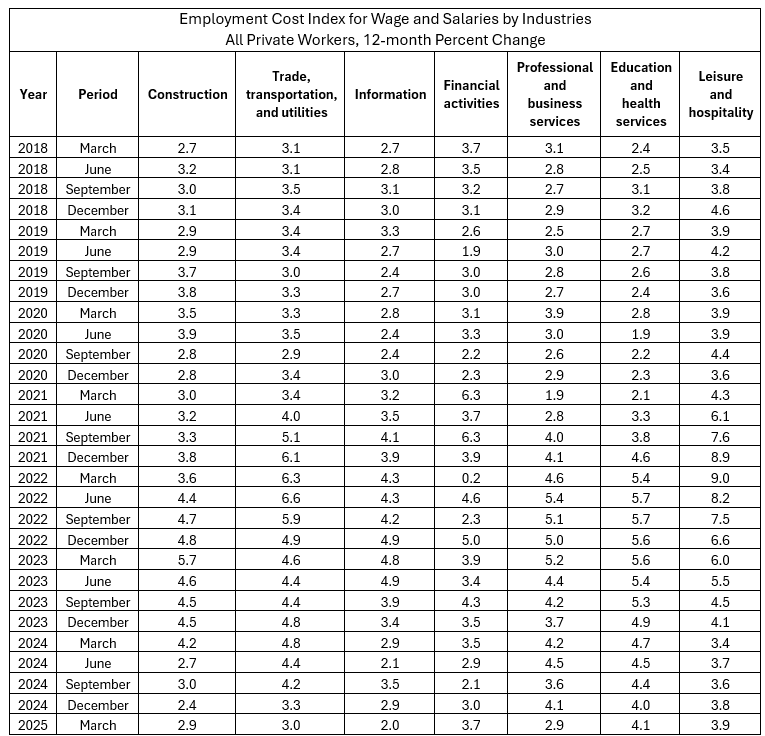
Year-on-year growth rates in the cost of salary and wages in Construction and Financial activities notably increased this quarter, while Education and health services and Leisure and hospitality each registered a small (0.1 percentage point) acceleration over Q4 2024 (Chart 5B and Table 3). In contrast, the 12-month ECI declined in Trade, transportation, and utilities; Information; and Professional and business services. For Professional and business services, the decline was more than a full percent point, dropping from 4.1 percent to 2.9 percent (Chart 5A and Table 3).
Chart 5
Institute for Compensation Studies
Data Source: U.S. Bureau of Labor Statistics, Employment Cost Index, March 2025, released April 30, 2025.
Table 3
Institute for Compensation Studies
Data Source: U.S. Bureau of Labor Statistics, Employment Cost Index, March 2025, released April 30, 2025.
Data Notes: The Employment Cost Index (ECI) is produced by the U.S. Bureau of Labor Statistics to measure trends in the costs of compensation paid by employers to their employees, controlling for composition of the workforce. The ECI is one of the labor market indicators used by the Federal Reserve Board to monitor the effects of fiscal and monetary policies and is released quarterly with a one-month lag.
Data for the Q1 2025 reference period (the 3-months ending in March 2024) were collected from a probability sample of approximately 26,600 occupational observations selected from a sample of about 6,200 private industry establishments and approximately 7,400 occupational observations selected from a sample of about 1,400 state and local government establishments that provided data at the initial interview.
Link to most recent ECI release: https://www.bls.gov/news.release/eci.toc.htm.
The Institute for Compensation Studies (ICS) at Cornell University’s ILR School is an interdisciplinary center that researches, teaches and communicates about monetary and non-monetary rewards from work, and how these rewards influence outcomes for individuals, companies, industries, and economies. At the crossroads between scholarship and practice, ICS is an exchange dedicated to helping new knowledge hit its mark in the world of work.
Contact:
Erica L. Groshen
Senior Economics Advisor
Institute for Compensation Studies
Authors:
Linda Barrington
Seung-Hun Chung
Erica L. Groshen
The Institute for Compensation Studies