What’s the best indicator of COVID-19’s impact on jobs?
The jobs report is coming! At 8:30 am. on Friday, May 8, the U.S. Bureau of Labor Statistics will issue its monthly “Employment Situation” release for April 2020. The report will include two distinct “headline” indicators: (1) the national unemployment rate and (2) the change in payroll jobs.
Drawn from separate surveys (of households and employers), both measure conditions at the middle of the month, but do it differently. And, in addition to the headline numbers, the Employment Situation reports thousands of other statistics. Now, in the midst of the COVID-19 downturn, all eyes will turn to this report. But, what should we pay attention to?
I served as commissioner of the Bureau of Labor Statistics from 2013 to 2017, so let me provide some perspective on this question. To start, let’s break the question into parts.
- Are there better sources of timely labor market data than the Employment Situation?
One prediction I am confident about is that the Employment Situation will move financial markets on Friday. It always does—even in non-crisis months—because it’s the most timely, comprehensive, historically comparable and authoritative gauge of the state of the U.S. economy. Even in times without the huge volumes of Unemployment Insurance initial claims testifying to huge job losses in the country, no other statistical release gets anything close to the attention received by the Employment Situation.
Other sources can offer valuable corroboration, additional detail or interim measures, but they are no substitute for these official statistics. New claims for unemployment insurance are more timely, but not as comprehensive, and can be affected by operational and policy quirks. The increasing number of novel private sector measures add helpful color and may be more immediate, but are less comprehensive and have less transparent methodologies.
- Are the data trustworthy?
Three general reasons you might question the quality of a statistic are methodological flaws, data manipulation and reporting problems. Fortunately, the Bureau of Labor Statistics, as an independent, professional, national statistical agency, is well-positioned to deal with these issues.
-
Methods: BLS maintains its world-class reputation by being transparent about its methods, and by engaging with experts and modernizing over time. For example, for this report, the bureau has already indicated that it will improve a step in its process for estimating payroll jobs to account for COVID-related lack of business formations (see https://www.bls.gov/ces/notices/2020/birth-death-notice.htm). Check out the documentation in its Handbook of Methods (https://www.bls.gov/opub/hom/) and wealth of technical notes attached to every release. Since all data have limitations, the agency’s strategy is to be fully transparent about the methods, virtues and limitations of all of its products. To help improve its data, it has a number of advisory committees to provide input from technical, academic and user communities (https://www.bls.gov/bls/infohome.htm).
-
Manipulation: The bureau is headed by Commissioner William Beach, a presidential appointee with a scientific background and a four-year fixed term, which means he does not serve at the pleasure of the president. The commissioner is the only appointee in the bureau and only sees statistical estimates after the staff declares them final. The staff maintains data integrity by an exceptional internal culture, agency directives and training, Office of Management and Budget statistical policy directives, background checks and Office of the Inspector General investigations, not to mention public scrutiny. For more, see https://www.bls.gov/bls/data_integrity.htm.
-
Reporting: The bureau obtains far higher survey response rates than achieved in private sector polls (see https://www.bls.gov/osmr/response-rates/). As with most bureau surveys, participation in the two Employment Situation programs is voluntary. The high participation reflects respondents’ willingness to provide an important public service and bureau efforts to educate them and minimize burden and risk. Not surprisingly, pandemic-related disruptions to families, employers and survey field staff reduced response rates to both Employment Situation surveys in March. For more information, see questions 2 and 5 in https://www.bls.gov/cps/employment-situation-covid19-faq-march-2020.pdf. Fortunately, the bureau found the response rates sufficient to meet its quality standards. This issue bears watching for April, of course.
-
- What are we trying to measure?
Concept differences can cause confusion and frustration in discussions. So, it’s important to be clear on what we’re trying to gauge. Here’s what I will be looking for—an overall assessment of what share of U.S. workers’ primary jobs have been disrupted, and whether the disruption may be temporary or permanent.
I will look at the headline indicators and then go further.
-
Change in payroll jobs.This measures the change in the number of workers on company payrolls from mid-March to mid-April. It has a long historical series, a large sample, and a lot of industry detail. It’s a reliable indicator of trends and comparisons to the past—and becomes even more so after it is revised and rebenchmarked. As I note above, for April, the bureau will apply a new method to incorporate the impact of establishment births and deaths in order to account for COVID-related impacts. So, the change in payroll jobs will be important to watch for understanding which industries have lost the most jobs.
-
Level and change in the unemployment rate. The unemployment rate tells us the share of the labor force that is unemployed. It also has a long history. In addition, it is never revised, provides demographic detail and covers people who are not on payrolls (that is, those who are self-employed, unemployed or out of the labor force). For these reasons, the unemployment rate is widely referenced in policy decisions and used to trigger some funding programs. The historical comparisons, policy relevance, comprehensiveness and demographic detail are key reasons to track the unemployment rate.
-
Additional indicators.These measures, also produced regularly by the Bureau of Labor Statistics, provide additional separate perspectives on labor market conditions.
-
Employment-to-population ratio.This measures the share of the population aged 16 or more who are employed. This ratio falls when workers become unemployed or exit the labor force even if temporarily.
-
Labor force participation rate.This tracks the share of the population that is either working or unemployed. It falls when workers exit the labor force at least temporarily.
-
Labor underutilization rate “U6”.This is the broadest of the agency’s set of labor underutilization measures. It counts as underutilized all workers who are unemployed or working part-time for economic reasons (that is, involuntarily) plus people who have left the labor force, but still want a job and have looked for one or worked sometime during the last 12 months.
-
-
Overall share of employment that has ended or been suspended. To get an even broader handle on how many workers are affected by COVID-19, we can combine a set of indicators from the household survey (the source of the unemployment rate). And, we can divide disrupted jobs between those where the workers remain connected to their employers and those where the tie is severed. (See my other article on why this matters.)
Because of the abrupt onset of the restrictions, we can compare current numbers with those for February, which is before there was much impact from the pandemic. Changes happening for other reasons in these two months will be swamped by the COVID-19 influence, so we will not worry about them. Then, we can add up all of changes as of April in the following indicators:-
Employed workers not at work—workers on leave from their employer, whether paid or not (for illness, family reasons, vacation, etc.)
-
Workers part-time for economic reasons—workers who prefer to work full-time but only found a part-time job or who usually work full-time but had their hours reduced by their employer
-
Unemployed workers on temporary layoff (furloughed)—laid-off workers who expect a recall within within 6 months
-
Unemployed workers not on temporary layoff—includes workers permanently laid off, new and re-entrants and job leavers
-
People out of the labor force who currently want a job—people without a job who are not looking for work but say they want a job
-
People out of the labor force who do not want a job—largely students, retirees, and people with disabilities or caring for family members
-
-
The first three categories capture workers whose relationships with an employer are intact despite disruptions, in contrast to the latter three.
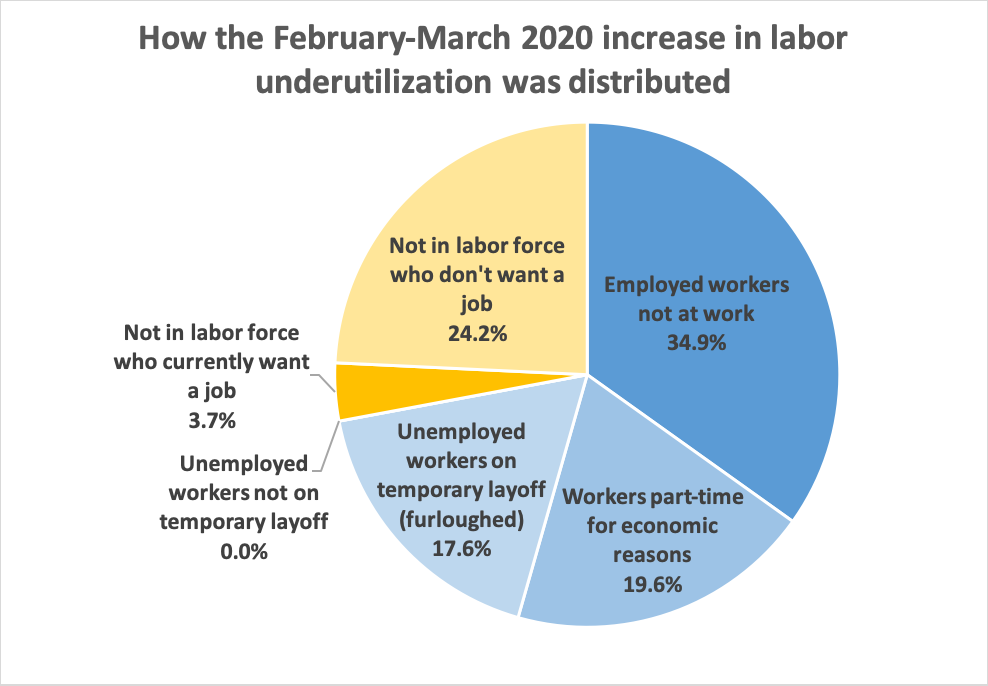
To give a taste for what we might see on Friday, the table below shows the numbers changes as of March (that is, from last month’s Employment Situation), when we saw the beginning of the COVID-19 impact. (Note for wonks: I don’t use seasonally adjusted data for comparability. Results for seasonally adjusted data are very similar.)
By this metric, about 4% of jobs were affected by mid-March. And of those, about 72 percent of the changes preserved a relationship with the employer. The figure shows percentages of impacted workers in a pie chart. The blue slices are the ones where the relationships between employer and worker are maintained.
If you are interested, come back to this hub after the Employment Situation jobs report is released May 8. I plan to post a table and figure like those below to help myself understand the magnitude of the COVID-19 impact on American jobs. For my initial thoughts on what the post-pandemic labor market might look like, please see this video, recorded in April.
| Thousands of people, NSA | Percent of total impacted | Percent of February employment | |
|---|---|---|---|
| Employed workers not at work | 2,281 | 35% | 1.4% |
| Workers part-time for economic reasons | 1,279 | 20% | 0.8% |
| Unemployed workers on temporary layoff (furloughed) | 1,154 | 18% | 0.7% |
| Unemployed workers not on temporary layoff | -2 | 0% | 0.0% |
| Not in labor force who currently want a job | 242 | 4% | 0.1% |
| Not in labor force who don't want a job | 1,586 | 24% | 1.0% |
| Total impacted | 6,540 | 100% | 4.0% |
Source: US Bureau of Labor Statistics, Current Population Survey and author’s calculations.