Living Wage Deep Dive
Calculating meaningful living wages
As we introduced in our Living-Wage Explainer, a living wage is the minimum hourly pay a full-time worker must earn to afford basic necessities.
Here, we’ll explore more details that go into calculating meaningful living wages.
Most living wage calculations use U.S. Department of Housing and Urban Development (HUD) data on Fair Market Rents (FMRs) for monthly housing expenses. It’s easy to calculate a housing wage from HUD FMR data. It does not require any more data from other areas of basic needs. It only needs one input: the local HUD FMR for the unit type (e.g., one- or two-bedroom) on which the calculation is to be based. Generally speaking, using the HUD FMR approach, the housing wage for a given location is equal to:
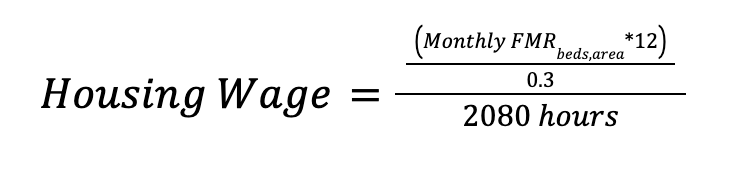
where FMRbeds,area is the FMR associated with the desired unit type (i.e., number of bedrooms) in a specific geographic area.
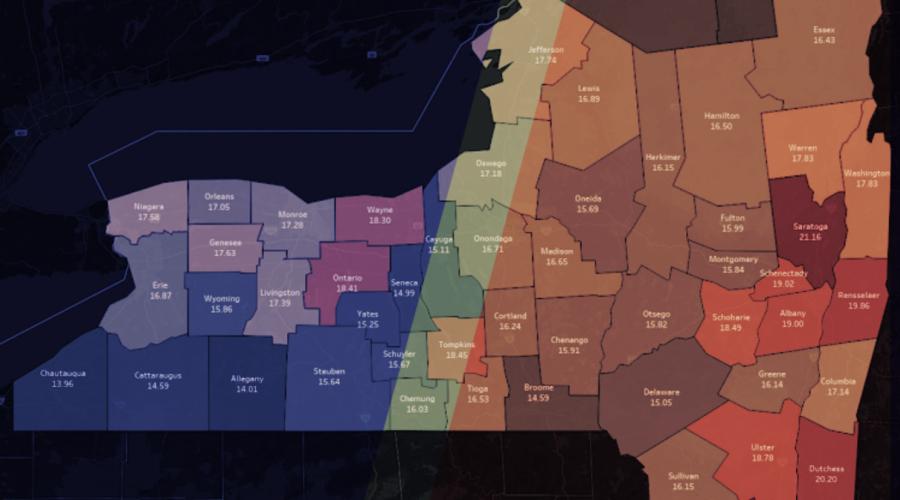
The housing wage summarized above is, as indicated, powered by HUD FMR data. The HUD FMR dataset reports 40th percentile gross rents, by unit size (i.e., number of bedrooms), for all counties in the U.S., as well as for zip codes in certain larger metropolitan regions. One potential challenge with using FMR data on one-bedroom units to compute county-level housing wages is that, especially in rural parts of a state, some counties might not have many one-bedroom units on which to base the calculation.
To use the example of Tompkins County, NY, current (2017-21 Five-Year) U.S. Census American Community Survey (ACS) data show that there are roughly 5,515 one-bedroom, renter-occupied housing units in the county. However, the same dataset reports that there are roughly 13,909 households that contain single individuals who are living alone. Thus, by focusing only on one-bedroom units, the FMR-based measure of a housing wage could potentially fail to capture the living situations for a meaningful fraction of the target population (e.g., single workers, without children, who live alone). One strategy to overcome this challenge, and to more holistically measure the costs of housing for certain types of households (e.g., single renters without children or roommates), is to draw on self-reported data on the rents paid by such households. The premier source for such data is the current U.S. Census ACS Public Use Microdata Samples (PUMS).
Briefly, PUMS “enable[s]…users to create custom estimates and tables…that are not available through ACS pretabulated data products. The ACS PUMS files are a set of records from individual people…with disclosure protection enabled so that individuals…cannot be identified.” The rich person- (worker-) level information contained in PUMS records allows researchers to construct detailed pictures of worker and economic conditions for numerous locations across the United States. Among other things, PUMS data make it possible to identify specific household types (e.g., single, working adults who live alone in rental housing and do not have children). In addition to providing data on their work and housing situations, all workers report to the Census Bureau the gross monthly rent that they pay to live in their home dwelling. Accordingly, using basic descriptive statistical techniques, it is possible to identify – in the spirit of HUD FMRs – the 40th percentile gross rent paid by households of interest in a living wage calculation (such as single renters who live alone in Tompkins County). Inflating that figure to be expressed in 2023 dollars offers yet another way to compute a housing/living wage. Crucially, mirroring the MIT Calculator’s ability to publish living wage estimates for a range of household types, PUMS data allow for the estimation of housing wages based on household composition (e.g., number of adults and children living in a housing unit), as opposed to computing a living wage as a single number for a specific location.
Comparison
Of the above-described methods, basic needs budgeting often hinges on publicly-available data published at the national or statewide scales. Even though it is possible to tap into proprietary commercial datasets to obtain more localized spending data, which might allow researchers to generate comparably bespoke living wage estimates for their study areas, such data are expensive to access and therefore largely inaccessible to the general public. As such, the most public-facing and regularly updated living wage computations typically apply the same statewide average spending data to all local (e.g., county-level) living wage estimates for at least some spending categories. The consequence is that certain expenditures will not vary by geography.
For example, in the highly-acclaimed MIT Calculator, a basic annual food budget for a single worker living in the high-cost Manhattan area of New York City ($4,559 per year) is equal to the food budget for a worker living in the rural Western New York County of Cattaraugus. Annual miscellaneous expenses are also assumed to be the same for these two areas (and for all other counties in New York State). This observation is not a critique of the MIT Calculator – which, again, is arguably the gold standard of living wage estimates – nor is it a critique of the basic needs budgeting method more generally. Instead, it is merely an observation that what are, on balance, the best publicly-accessible datasets used to compute living wages through this method tend to have relatively coarse spatial resolutions.
By contrast, data on housing costs – whether from HUD FMR datasets or household-specific sources like the ACS PUMS – offer greater geographic precision. Even so, one potential downside with relying exclusively on housing data to compute a living wage is that it can be difficult to identify who exactly lives in “basic needs” housing and how much such housing costs. HUD’s heuristic of taking the 40th percentile of gross rents in a location is instructive here. However, even with this approach it is possible that, by the nature of the competitive housing market, some workers get pushed into housing situations that either (a) fail to meet their basic needs, (b) force them to live outside their means, or (c) some combination of these outcomes. These possibilities suggest that even the 40th percentile of gross rents might not offer a perfect mirror of workers’ housing realities.
The major takeaway, then, is that there is no one, nor one optimal, way to compute a living wage. Which method one chooses should be matched to the goals and objectives of their project or campaign.