What the April 2020 Jobs Report says about COVID-19’s impact
The jobs report (formally, the Bureau of Labor Statistics’ Employment Situation news release) for April 2020 is out. You’ve probably already seen media coverage that highlighted the scary numbers about the impact of COVID-19 on jobs and mentioned some confusing caveats. In this post, I present my quick parsing of what this adds up to.
Yesterday, I published a post to set the stage for today by giving the background on why the monthly Employment Situation release is so influential. I also discussed some indicators that I would be focusing on. I won’t repeat all that background here, so it may be helpful to read that post before you go further.
So, here we go.
1. There are not serious data quality issues, although putting together the report was challenging.
- Methods – BLS published an accompanying note documenting notable methodological issues they encountered in compiling the data and how they managed them.
- Manipulation – I’m happy to say that the practices, laws and directives that protect the integrity of BLS data continue in place. I am unaware of any attempt, successful or not, to manipulate these data.
- Response rates – Not surprisingly, as in March, pandemic-related disruptions reduced response rates to the household survey by 13 percentage points in April. The overall response rate for the payroll survey was normal. For more information, see questions 2 and 5 in https://www.bls.gov/cps/employment-situation-covid19-faq-april-2020.pdf. Fortunately, the bureau found the response rates sufficient to meet its quality standards.
2. The release documents a labor market slump of historic magnitude.
- Headline indicators swooned
- Payroll jobs declined by 20.5 million, and last month’s estimate was revised by an unusually large -169,000 to -870,000. April had the largest drop in jobs in the 80-year history of the series in either numbers or percentages.
- The unemployment rate soared to 14.7 percent. This number, which will go down in history as is, is the highest level of unemployment and the largest jump in the rate in the 75-year history of the measure (since January 1945). And, the bureau suggests that the true measure may be around 20 percent, because once again, many workers who responded that they were employed but not at work really belong in the temporary layoff category.
- Additional indicators provide more perspectives on the historically unprecedented deterioration in labor market conditions.
- The employment-to-population ratio fell from 59.7 to 51.3 as large numbers of workers become unemployed or left the labor force.
- The labor force participation rate dropped from 62.6 percent to 60 percent in March and 63.3 in February as workers exited the labor force at least temporarily.
- The labor underutilization rate “U6” jumped to 22.8 percent from 8.7 percent in March and 7.0 percent in February. The broadest of the agency’s labor underutilization counts as underutilized all workers who are unemployed or working part-time for economic reasons (that is, involuntarily) plus people who have left the labor force, but still want a job and have looked for one or worked sometime during the last 12 months.
- Overall, the COVID crisis has suspended or curtailed about 23.4 percent of U.S. employed workers. Of those, 79 percent maintained a tie with their employer, while the remaining 21 percent did not and exited the labor force. To estimate this, we combine these indicators:
- Employed workers not at work—workers on leave from their employer, whether paid or not (for illness, family reasons, vacation, etc.)
- Workers part-time for economic reasons—workers who prefer to work full-time but only found a part-time job or who usually work full-time but had their hours reduced by their employer
- Unemployed workers on temporary layoff (furloughed)—laid-off workers who expect a recall
- Unemployed workers not on temporary layoff – includes workers permanently laid off, new and re-entrants and job leavers
- People out of the labor force who currently want a job—people without a job who are not looking for work but say they want a job
- People out of the labor force who do not want a job—largely students, retirees, and people with disabilities or caring for family members
Because extreme restrictions were imposed abruptly, we can compare current numbers with those for February, which is before there was much impact from the pandemic. Changes happening for other reasons over these two months will be swamped by the COVID-19 influence, so we will not worry about them. The first three categories capture workers whose relationships with an employer are intact despite disruptions, in contrast to the latter three. See here for why that matters.
The table below shows the total changes from mid-February to mid-April. (Note for wonks: I don’t use seasonally adjusted data for comparability. Results for seasonally adjusted data are very similar.)
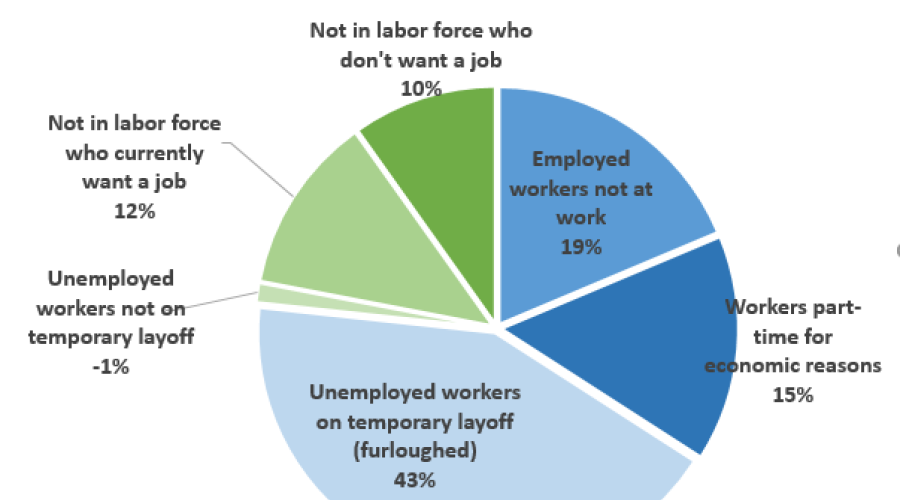
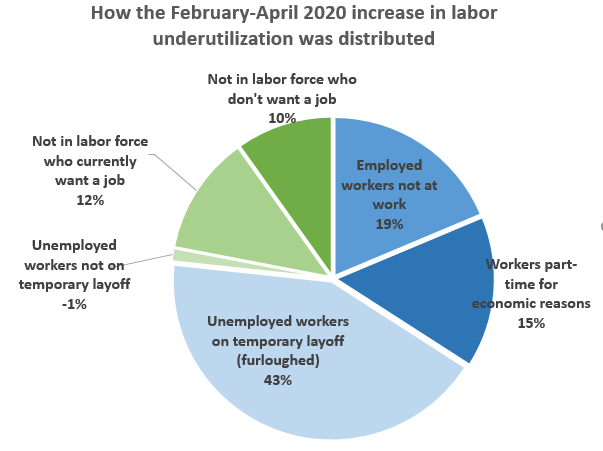
The bottom line is that the jobs of about 23.4 percent of employed workers were suspended or curtailed by COVID by mid-April. The largest segment of those are workers on temporary layoff. Of those affected, about 79 percent preserved a relationship with their employer. The pie chart shows the percentages of impacted workers, with blue slices where the relationships between employer and worker are maintained.
Most starkly, all of the permanent job losers exited the labor force (that is, they are not actively looking for work). And, close to half of those say they do not want a job at the moment.
The high share (79 percent) of maintained relationships with employers should be helpful for speeding the recovery when restrictions are lifted. However, this alone cannot guarantee a rapid recovery, because ties can weaken over time, some employers will not survive long enough to recall their workers and other employers may need a new business model with different staffing requirements.
| Thousands of people, NSA | Percent of total impacted | Percent of February employment | |
|---|---|---|---|
| Employed workers not at work | 7,366 | 19% | 4.5% |
| Workers part-time for economic reasons | 6,084 | 16% | 3.7% |
| Unemployed workers on temporary layoff (furloughed) | 16,809 | 44% | 10.2% |
| Unemployed workers not on temporary layoff | -523 | -1% | 0.3% |
| Not in labor force who currently want a job | 4,788 | 12% | 2.9% |
| Not in labor force who don't want a job | 3,885 | 10% | 2.4% |
| Total impacted | 38,409 | 100% | 23.4% |
Source: US Bureau of Labor Statistics, Current Population Survey and author’s calculations.