May 2020 Jobs Report Update on COVID-19’s Impact on Jobs
The jobs report (that is, the Bureau of Labor Statistics’ Employment Situation news release) for May 2020 is out. In short, U.S. labor market conditions, the worst since the Great Depression, showed surprising, albeit minor, signs of rebound in May. Most measures recouped about a tenth of their pandemic crash. This post presents my quick parsing of the report. A later post will examine differences by gender and race.
Last month, I published a post on why the jobs reports are so influential and to discuss some indicators I track to understanding the impact of COVID-19. Last month’s take on the April numbers can be found in this post. I won’t repeat that background here, so it may be helpful to read the posts before you go further.
Here are my initial takeaways from the May report:
-
Data quality is good. Again, the Bureau of Labor Statistics reported no serious data quality issues (with one exception), even though putting together the report was challenging. The bureau’s accompanying note documents methodological issues encountered in compiling the data and how it managed them.
-
Integrity: Given the slight rebound, some observers have voiced fears that the data might be tainted. I’m happy to say that the practices, laws and directives that protect the integrity of Bureau of Labor Statistics’ data continue. I am unaware of any attempt, successful or not, to manipulate these data. See my explainer for information on bureau data integrity practices. Note also that the two independent surveys that make up the Employment Situation agree on the rebound and its general scale. Manipulating both would be even harder to achieve without detection than manipulating just one.
-
Misclassification in the household survey: See questions 9-13 of the note. Since March, the Bureau of Labor Statistics has reported that the true unemployment rate is likely higher than the official rate because many workers who responded that they were employed but not at work, really belonged in the temporary layoff category. This problem persisted in May, albeit abated. The bureau is clear about working to reduce this problem going forward. This issue merits its own post, which will go up shortly.
-
Response rates: Pandemic-related disruptions reduced household survey response rates to 67 percent in May, a further deterioration from the February rate of 83 percent. Payroll survey response rates (69 percent) were also below normal. For more information, see questions 2 and 5 in the bureau note. Thanks to their extraordinary efforts, bureau staff attained response rates sufficient to meet their quality standards.
-
Revisions: The bureau retroactively applied its new birth-death estimator to the March payroll data. That resulted in an unusually large downward revision (-492,000) to payroll jobs for March. That change, which I find fully appropriate, is discussed in question 3 of the note.
-
-
We remain in a labor market slump of historic magnitude, even though headline and other indicators recovered slightly.
-
Payroll jobs increased by 2.5 million in May, which represents 11 percent of the 22.1 million jobs lost from February to April. In addition, the March and April estimates were revised down by large amounts: by -492,000 and -150,000, respectively. While April’s losses were remarkably widespread (96 percent of industries lost jobs), the gains this month were less so: 67 percent of industries recouped some jobs.
-
The official unemployment rate declined by 1.4 percentage points to 13.3 percent. The Bureau of Labor Statistics estimates that had there been no misclassification, the unemployment rate would be 16.4 percent, and would have declined by 3.1 percentage points. So, paradoxically, the misclassification this month leads to understating both the severity of current conditions and the size of May’s rebound.
-
The employment-to-population ratio rose from 51.3 to 52.8 as some workers returned to the labor force, although it remains far below February’s ratio of 61.1.
-
The labor force participation rate, which was 63.3 percent in February, regained 0.6 percentage points in May, reaching 60.8 percent.
-
The labor underutilization rate “U6” declined to 21.2 percent from 22.8 percent in April. In February, the U6 was just 7.0 percent. U6 is the broadest of the agency’s labor underutilization measures. U6 counts as underutilized all workers who are unemployed or working part-time for economic reasons (that is, involuntarily), plus people who have left the labor force, but still want a job and have looked for one or worked during the last 12 months.
-
-
My COVID-19 disruption table adds up six distinct ways the crisis has disrupted (suspended or curtailed) the jobs in the U.S. workforce. I use it to track the rebound and the status of the remaining disrupted workers.
-
The indicators. Since disruptions can take many forms, I track these indicators in the attached table and figure:
-
Employed workers not at work—workers on leave from their employer, whether paid or not (for illness, family reasons, vacation, etc.—the bureau believes that many of these are misclassified workers actually on temporary layoff, see the bullet on misclassification above)
-
Workers part-time for economic reasons—workers who prefer to work full-time but only found a part-time job or who usually work full-time but had their hours reduced by their employer
-
Unemployed workers on temporary layoff (furloughed)—laid-off workers who expect a recall
-
Unemployed workers not on temporary layoff—includes workers permanently laid off, new and re-entrants and job leavers
-
People out of the labor force who currently want a job—people without a job who are not looking for work but say they want a job
-
People out of the labor force who do not want a job—largely students, retirees, and people with disabilities or caring for family members
My measure of COVID-19 disruptions is simply the change in the number of workers in each category since February. The first three categories capture workers whose relationships with an employer are intact despite disruptions, in contrast to the latter three. See here for why that matters. (Note for wonks: I use seasonally unadjusted data, for comparability.)
-
-
Rebound. By this metric, the number of disrupted workers declined by about 7.4 million in May. The first two columns of the table show how the strongly the rebound affected each type of disrupted workers. Most (four-fifths) of the action is from fewer workers on temporary layoff: 43 percent of the improvement came fewer workers employed but not at work (that is, the misclassified temporary layoffs) and 38 percent from fewer workers correctly classified as on temporary layoff. The similarity in the movement is consistent with the Bureau of Labor Statistics’ view of the misclassification problem. This also reflects the ease of recalling workers on temporary layoff, likely aided, in many cases, by the Payroll Protection Program.
The other sizable improvement was in the number of people out of the labor force who said they did not want a job. Reductions in that group accounted for 22 percent of the rebound. Interestingly, this segment declined much more than the category of people who said that they want a job.
Also encouraging, the number of people actively looking for work increased in May. Thus, some of the improvement in other categories was due to more people searching for jobs.
-
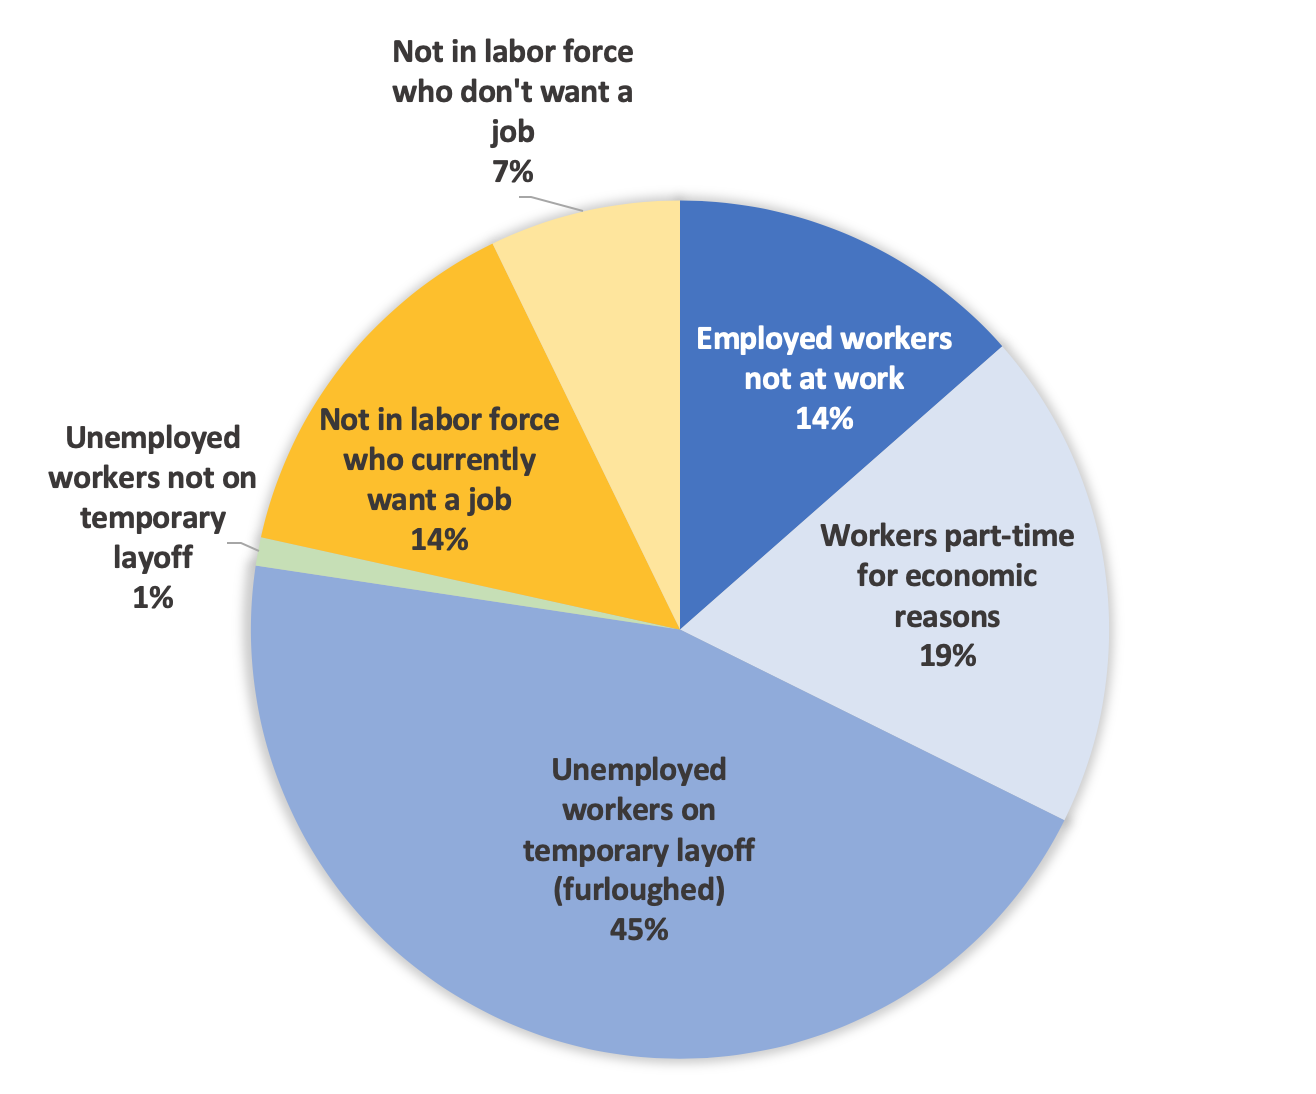
Remaining disruptions. The third and fourth columns of table show that in May, the jobs of 31 million workers (about 19 percent of the U.S. labor force in February) were still seriously disrupted by COVID-19. The pie chart shows the percentages in the fourth column of the table.
Of those still disrupted, 45 percent are on temporary layoffs (furloughs). If we follow BLS and consider the 14 percent counted as employed but not at work to be on temporary layoff, we get 59 percent on temporary layoff. Another large group (19 percent) is working short hours. In all, 78 percent of disrupted workers maintain a tie with an employer. These are shown in the blue slices of the pie chart.
Very few (1 percent) are unemployed with no connection to an employer. So, we can infer that the people who lost jobs permanently mostly stayed on the sidelines in May, without looking for work. This group can be broken into two segments: the 14 percent who want work and the 7 percent who said they do not want a job at the moment.
-
-
Implications for the future
In the best-case scenario, April will have been the job market low point (trough) of the COVID-19 downturn. That is, subsequent reports will show lower unemployment rates and show increasing number of jobs.
Why would it be the trough? The time period (mid-April to mid-May) covers the period of maximum shutdowns. Since May, no states have increased restrictions and most have begun phasing them out, allowing more workers to return to work. Furthermore, substantial Payroll Protection Program funds were distributed in May, funding the recall of many workers. Continuation of loosening and policy support would allow the improvements to continue.
Even if April was the trough, we are far from assured of a rapid recovery. The high share (78 percent) of maintained relationships with employers should be helpful for speeding the recovery when restrictions are lifted, particularly early in the recovery. Yet, much could go wrong.
Despite May’s modest rebound, job market conditions remain dire. The May unemployment rate is far higher than at the trough of the Great Recession. Much of the rebound must have happened before states started loosening restrictions, likely aided by the Payroll Protection Program. The good news is that the program worked. The bad news is that its impact is about to expire. We know from initial unemployment insurance claims that layoffs were probably still high throughout May, so those are likely to be recession fallout rather than direct impacts of the COVID-19 shutdown. That's also bad news. So, all signs point to the importance of fiscal policy steps going forward.
Spikes in virus infection rates, more civil unrest or lack of fiscal policy support to fend off a cyclical downward spiral could derail or slow the nascent recovery. Confidence, investment and spending will take time to restore. Even employers who intended to recall their workers may go bankrupt instead of reopening or adopt a new business model with different staffing requirements. Also, the mass exit of permanently laid-off workers from the labor force could be problematic. Some exits will be permanent as bouts with the virus result in disabilities for some people, some older workers speed their retirements, others give up paid work to care for loved ones to avoid nursing homes and people with underlying conditions determine that it is not safe to return to their occupations.
Thus, policy will be very important to help support as robust a recovery as possible.
| Rebound: April to May change | Remaining disruptions: February to May change | |||
|---|---|---|---|---|
| Thousands of disrupted workers | Share of rebound | Thousands of disrupted workers | Share of disrupted workers | |
| Employed workers not at work | -3,174 | 43% | 4,192 | 14% |
| Workers part-time for economic reasons | -255 | 3% | 5,829 | 19% |
| Unemployed workers on temporary layoff (furloughed) | -2,844 | 38% | 13,965 | 45% |
| Unemployed workers not on temporary layoff | 854 | -12% | 331 | 1% |
| Not in labor force who currently want a job | -339 | 5% | 4,449 | 14% |
| Not in labor force who don't want a job | -1,656 | 22% | 2,230 | 7% |
| Total disrupted | -7,414 | 100% | 30,996 | 100% |
| Share of February labor force (164,235) | 5% | 19% | ||
Source: US Bureau of Labor Statistics (Current Population Survey) and author’s calculations. Not seasonally adjusted.