
Will the True Unemployment Rate Please Stand Up?
The Bureau of Labor Statistics’ May 2020 jobs report surprised pretty much everyone. After two months of historically unprecedented decline in labor market conditions, instead of more slippage we saw a partial rebound. Employment rose and unemployment fell. (See my post about it here.) Their expectations defied, some observers rushed to question the integrity of the numbers.
They are wrong on all counts. This post delves into the heavily tweeted and rebutted assertion that the bureau mishandled a misclassification issue that it reported in the news release. Some critics see the issue as a sign of political tampering or incompetence. What I report below benefits hugely from what I learned from the staff while I served as the bureau’s commissioner from 2013 to 2017.
One strand of doubt this week that I won’t dwell on are unfounded accusations of some unspecified tampering. I discuss and dismiss this issue generally in my explainer on the jobs report during the COVID-19 era. For May, let me also note that the rebounds seen in the independent employer and household surveys that form the basis of the jobs report are mutually reinforcing. Manipulating either without detection would be basically impossible, and so much more so to tamper with two.
To be clear, everyone is entitled to verify and offer constructive criticism of the bureau’s methods. After all, statistical agencies are accountable to the public and have a duty to be transparent. Statistical agencies must earn the public’s trust in order to achieve their mission of informing public and private decisions. But that doesn’t mean that all criticisms are correct.
What is the misclassification issue?
Here is how the Bureau of Labor Statistics describes the issue (see question 12 in this note) with the Current Population Survey (often called the “household survey” in the jobs report):
“Other than those who were themselves ill, under quarantine, or self-isolating due to health concerns, people who did not work during the survey reference week (May 10–16) due to efforts to contain the spread of the coronavirus should have been classified as ‘unemployed on temporary layoff.’ However, as happened in April and March, some people who were not at work during the entire reference week for reasons related to the coronavirus were not included in this category. Instead, they were misclassified as ‘employed but not at work.’”
Essentially, the category of “employed but not at work” refers to workers who are away from the job for an employee-initiated reason, such as illness, vacation, family leave, jury duty, national guard service, etc. Employees off work due to pandemic-related shutdowns belong in the category “unemployed on temporary layoff.” They do not need to search for other work to be in this category.
The point is that neither the questions nor the interviewers have changed. Rather, when circumstances changed from anything encountered previously, people responded to the survey in a way that led them to be misclassified.
Back in October 2013 (while I was there), the bureau first encountered this misclassification problem during the federal government shutdown. This 2013 note from the bureau explains the situation with nearly the same language and follows the same procedure used in 2020. Of course, the duration and magnitude of the COVID-19 shock means that this issue is far more consequential now than in 2013 or ever before.
How did this happen?
COVID-19 altered many things rapidly. Most Bureau of Labor Statistics methods for tracking the labor market have proven solid despite these disruptions. In retrospect, it’s no surprise that some survey questions did not withstand the extreme stresses imposed by the pandemic. Indeed, it’s a credit to the bureau that all the other Current Population Survey questions proved unproblematic.
For a picture of how things unfolded, I refer you to successive bureau notes for March , April and May and this summary table.
Sum of reported workers on temporary layoff and bureau estimate of misclassified workers
| Labor market status (millions) | March | April | May |
|---|---|---|---|
| Unemployed workers on temporary layoff, as reported | 2.2 | 17.9 | 15.0 |
| Bureau best estimate of workers on temporary layoff who were misclassified as “employed but not at work” | 1.4 | 7.5 | 4.9 |
| Sum of reported workers on temporary layoff and bureau estimate of misclassified workers | 3.6 | 25.4 | 19.9 |
| Misclassification percentage | 39% | 30% | 25% |
Source: U.S. Bureau of Labor Statistics and author’s calculations.
My reading is as follows. In advance of the March survey, remembering the misclassifications in October 2013, the bureau reviewed lessons learned and issued special COVID-19 guidance to the Census Bureau interviewers who field the survey. The purpose of the guidance was to ensure that temporary layoffs would be properly counted as such.
When the March survey responses arrived, Bureau of Labor Statistics staff checked the data and saw a problem. Their best estimate is that about 1.4 million workers on furlough answered questions as if they were employed but out on some kind of leave. With the benefit of hindsight, this makes sense if many employers and employees had informal arrangements (with no name to call the situation), or agreed to charge the time to some leave category. Many probably had no prior experience with temporary layoffs. Self-employed workers or contractors with no work may also have answered in this way. And, many interviewers may not have seen this situation before. Combined with the 2.2 million workers correctly classified as on temporary layoff, about 39 percent of workers on temporary layoff were likely misclassified in March.
In preparation for the April data collection, the Bureau of Labor Statistics transmitted concerns to interviewers and reiterated the previous COVID-19 guidance. No doubt these were received in the midst of many other disruptions during that chaotic time. Unfortunately, the intervention failed to resolve the problem. Employers temporarily laid off a huge share of the workforce in April. Although a smaller share of temporary layoffs appear to have been misclassified than in March (30 percent), the scale of layoffs was much larger in April, so 7.5 million temporary layoffs were likely misclassified.
For May, the bureau redoubled efforts, describing it as follows:
“Due to the unusual circumstances related to the pandemic, Census Bureau interviewers were given additional training prior to collecting data in May. Supervisors held all-interviewer training sessions and reviewed the guidance that had been provided in March and April on how to record answers to the three survey questions detailed below.”
Yet the problem persisted in May. The share of temporary layoffs likely misclassified declined further to 25 percent, but that still resulted in about 4.9 million likely misclassifications. The bureau plans urgent research to get to the bottom of these difficulties and craft a solution. No doubt they will investigate differences between workers who were and were not misclassified, such as occupation, demographics, firm size, self-employment or contractor, etc. All these answers can help the bureau craft better guidance or questions in the future. Sadly, in this fraught environment, some observers have latched on to this problem as evidence of tampering or incompetence.
Why doesn’t the bureau apply its misclassification estimates to “fix” the official unemployment rate?
Most notably, the misclassifications have introduced a consequential underestimate of the official unemployment rate, particularly for April. Table B shows the official unemployment rate along with the bureau’s estimate of the impact of the misclassifications by month. The figure below illustrates the impact visually.
|
Percent of the labor force, seasonally adjusted |
|||||
|---|---|---|---|---|---|
| Official unemployment rate | Estimated impact of correcting misclassifications | Total: official rate plus impact of misclassifications | Over-the-month unemployment rate change | ||
| Official | Total | ||||
| February | 3.5 | -- | 3.5 | -0.1 | -- |
| March | 4.4 | +0.9 | 5.3 | 0.9 | 1.8 |
| April | 14.7 | +4.8 | 19.5 | 10.3 | 14.2 |
| May | 13.3 | +3.1 | 16.4 | -1.4 | -3.1 |
Source: U.S. Bureau of Labor Statistics and author’s calculations.
Figure: Official unemployment rate and estimated impact of misclassifications in early 2020
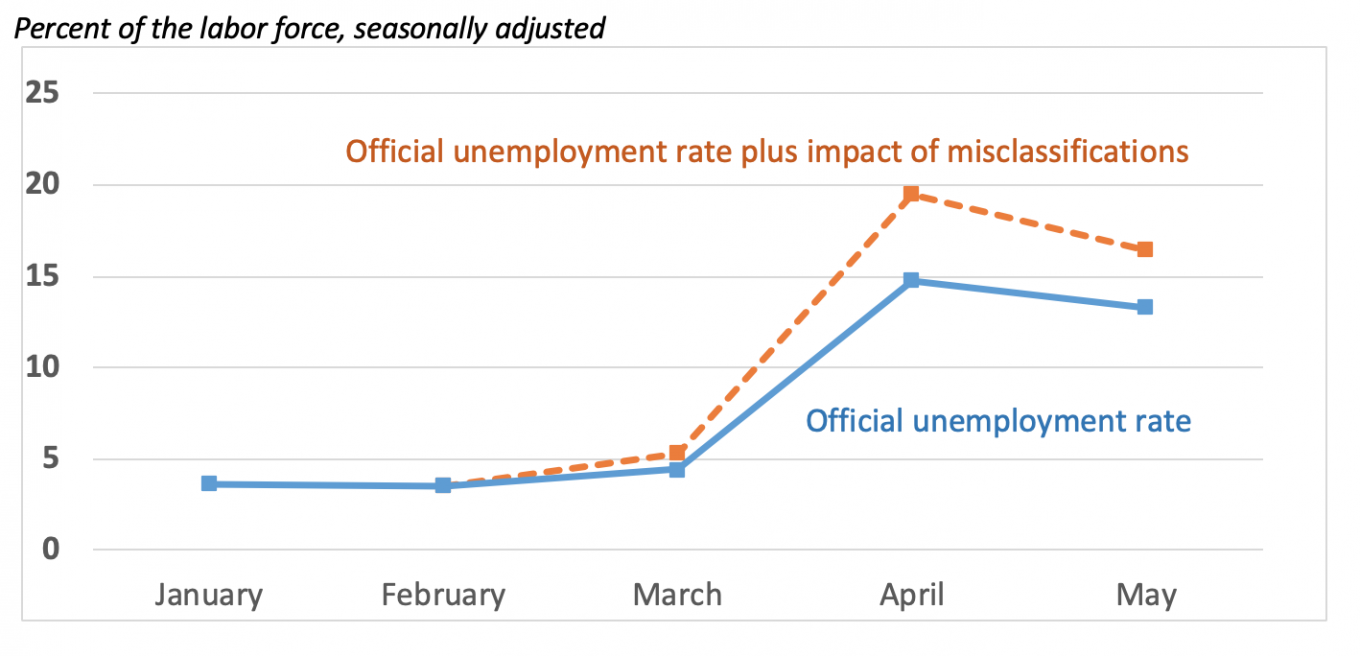
Source: U.S. Bureau of Labor Statistics.
As the table and figure show, the impact of the misclassifications is consequential in both levels and changes. Yet, the bureau has announced that it will not use its misclassification estimates to adjust the official unemployment rate for March, April or May. There are at least three reasons for this decision.
- First, the bureau notes that changing respondent answers violates its practices. Changing answers received carries the real risk of setting an unwelcome precedent, putting the BLS at the edge of the proverbial slippery slope. The future could see a rash of recoding demands for less legitimate reasons. In addition, the public could rightfully be less certain that published statistics reflect the underlying data collected.
- The bureau’s estimated impacts cannot identify exactly which respondents made the errors. If it were to recode responses, staffers would have to select whose answers to change. So, any recoding would be essentially arbitrary and risk biasing other measures throughout the report, such as detail by race, sex, region, etc. Alternatively, if the agency adjusted the top line without changing underlying microdata, many other statistics would no longer add up to the total properly or be internally consistent.
- And, the bureau’s method for estimating the impact of misclassifications has not been vetted. Official statistics methods are normally subject to rigorous review before they are used in government reports. However, in these circumstances, they performed no cognitive research with respondents, published no papers and consulted no advisory committee. Experienced, world-class professional staff produced useful and credible impact estimates in a short amount of time. But this is not the normal process for producing an official statistic.
Which unemployment rate should you use, official or with correction for misclassifications?
There is no one answer because it depends on the use you have in mind. Whatever your intended use, you can and should ask the bureau for guidance on how to proceed.
Using the official rate is probably the best advice in most cases. This avoids confusion and ensures consistency with local or demographic subgroup unemployment rates, because demographic and local rates will not be adjusted for misclassification.
However, policymakers need to be aware that the official rate understates the severity of the recession for three months. That is, the April “total” unemployment rate of 19.5 percent in the table is probably the better number than the official one to compare to the 1938 Great Depression maximum of about 25 percent or the 2009 Great Recession high of 10 percent to understand the depth of the downturn. This comparability to historical statistics implies that some econometric modelers and researchers may opt to use adjusted rates in their work.
Going forward, I expect misclassifications to subside. For one, the bureau indicates that they intend to work very hard with the Census Bureau to reduce misclassifications quickly. Also, when the recovery picks up steam, the number of people on temporary layoff will decline anyway, lessening the potential for misclassifications.
What are the bottom line and lessons learned from this episode?
The misclassifications were caused by COVID-19-related severe and unusual circumstances—not incompetence or tampering. The main consequence may be that some data users will forever add an asterisk to these three months’ national unemployment rate. That’s undeniably awkward, but chalk it up as one more cost of the COVID-19 pandemic.
I close with a few other lessons to draw from this episode.
- Official statistics are critical infrastructure. No other source of labor market information was broad and authoritative enough to have alerted observers to May’s rebound before the jobs report came out. The ensuing debate and concern about the quality of the data was so fierce because this information really matters to decision-makers throughout the country. Dollars invested in official statistics have a large payoff.
- Making gold-standard statistics is difficult, especially during extraordinary times. National statisticians must be as transparent as possible, while always modernizing and preserving continuity. Even as the economy changes, they must accurately collect, process and vet huge amounts of data on a very tight time frame. And, everyone is watching.
- Public trust in official statistics matters. A key contributor to preserving data integrity and public trust is maintaining the independence of statistical agencies from political interference. The many practices that preserve the Bureau of Labor Statistics’ independence has served it well during the recent questioning and helped to direct most people’s attention to the real issues.